A Practical Guide To Race Car Data Analysis provides crucial insights into vehicle and driver performance, transforming raw data into actionable strategies for optimizing speed and handling. At CONDUCT.EDU.VN, we offer comprehensive resources to help you master race car data acquisition, empowering you to make informed decisions that lead to victory. Explore the science behind motorsport telemetry, performance metrics, and competitive edge analysis, all designed to take your racing skills to the next level.
1. Understanding the Essence of Race Car Data Analysis
Race car data analysis is the process of systematically examining information gathered during testing or racing to improve performance. This includes interpreting telemetry data, which measures various parameters like speed, acceleration, braking force, and suspension movement, to understand how the car and driver are performing.
1.1. The Role of Telemetry
Telemetry involves the remote measurement and transmission of data. In race cars, sensors collect data from various parts of the vehicle, sending it to a central logging system. This data is then analyzed to identify areas for improvement.
1.2. Key Metrics to Analyze
Several key metrics can be analyzed from race car data:
- Speed: Measures the car’s velocity at different points on the track.
- Acceleration: Indicates how quickly the car gains speed.
- Braking Force: Shows the intensity of braking applied by the driver.
- Throttle Position: Reveals how much the driver is using the throttle.
- Steering Angle: Indicates the angle of the steering wheel.
- Suspension Travel: Measures the movement of the suspension components.
- Engine RPM: Shows the engine’s rotational speed.
- Tire Pressure and Temperature: These factors significantly affect grip and handling.
1.3. Benefits of Data Analysis
Analyzing race car data provides several benefits:
- Improved Car Setup: Helps engineers fine-tune the car’s setup for optimal performance.
- Enhanced Driver Technique: Identifies areas where the driver can improve their driving style.
- Increased Speed and Consistency: Leads to faster lap times and more consistent performance.
- Reduced Risk of Mechanical Failure: Identifies potential issues before they lead to breakdowns.
2. Essential Tools and Technologies for Data Analysis
To effectively analyze race car data, you need the right tools and technologies. These include data loggers, sensors, and software for data analysis and visualization.
2.1. Data Loggers
Data loggers are electronic devices that record data from various sensors on the race car. They are the backbone of any data acquisition system. Modern data loggers can record hundreds of channels of data at high frequencies.
2.2. Sensors
Sensors measure various parameters on the race car, converting them into electrical signals that can be recorded by the data logger. Common sensors include:
- Accelerometers: Measure acceleration in multiple axes.
- Gyroscopes: Measure the car’s rate of rotation.
- Potentiometers: Measure displacement, such as suspension travel.
- Strain Gauges: Measure force and torque.
- Temperature Sensors: Measure the temperature of various components.
- Pressure Sensors: Measure pressure in various systems, such as the braking system.
2.3. Data Analysis Software
Data analysis software is used to process and visualize the data recorded by the data logger. This software allows you to create graphs, charts, and other visualizations to identify trends and patterns in the data. Popular data analysis software includes:
- MoTeC i2 Pro: A professional-grade data analysis tool widely used in motorsport.
- Aim Race Studio 3: A user-friendly software package for analyzing data from Aim data loggers.
- VBOX Test Suite: A comprehensive software suite for analyzing data from VBOX data loggers.
- ATLAS: A sophisticated data analysis tool used by Formula 1 teams.
2.4. Hardware Requirements
In addition to the data logger, sensors, and software, you will also need a computer to run the data analysis software. The computer should have a fast processor, plenty of RAM, and a high-resolution display for viewing the data.
3. Setting Up Your Data Acquisition System
Setting up your data acquisition system correctly is crucial for obtaining accurate and reliable data. This involves selecting the right components, installing them properly, and configuring the data logger to record the desired parameters.
3.1. Selecting the Right Components
When selecting components for your data acquisition system, consider the following factors:
- Accuracy: Choose sensors and data loggers with the required accuracy for your application.
- Sampling Rate: Select a data logger with a sampling rate high enough to capture all the important events.
- Number of Channels: Choose a data logger with enough channels to record all the desired parameters.
- Durability: Select components that are durable enough to withstand the harsh environment of a race car.
- Compatibility: Ensure that all components are compatible with each other.
3.2. Installing the Components
Proper installation is essential for accurate data. Follow these guidelines:
- Mount Sensors Securely: Mount sensors securely to prevent them from moving or vibrating.
- Route Cables Carefully: Route cables carefully to avoid interference and damage.
- Protect Data Logger: Protect the data logger from moisture and vibration.
3.3. Configuring the Data Logger
Configure the data logger to record the desired parameters at the appropriate sampling rate. This involves setting up the channels, calibrating the sensors, and configuring the data storage options.
4. Basic Data Analysis Techniques
Once you have collected data from your race car, you can start analyzing it using basic data analysis techniques. These techniques include examining data plots, calculating statistics, and identifying key events.
4.1. Examining Data Plots
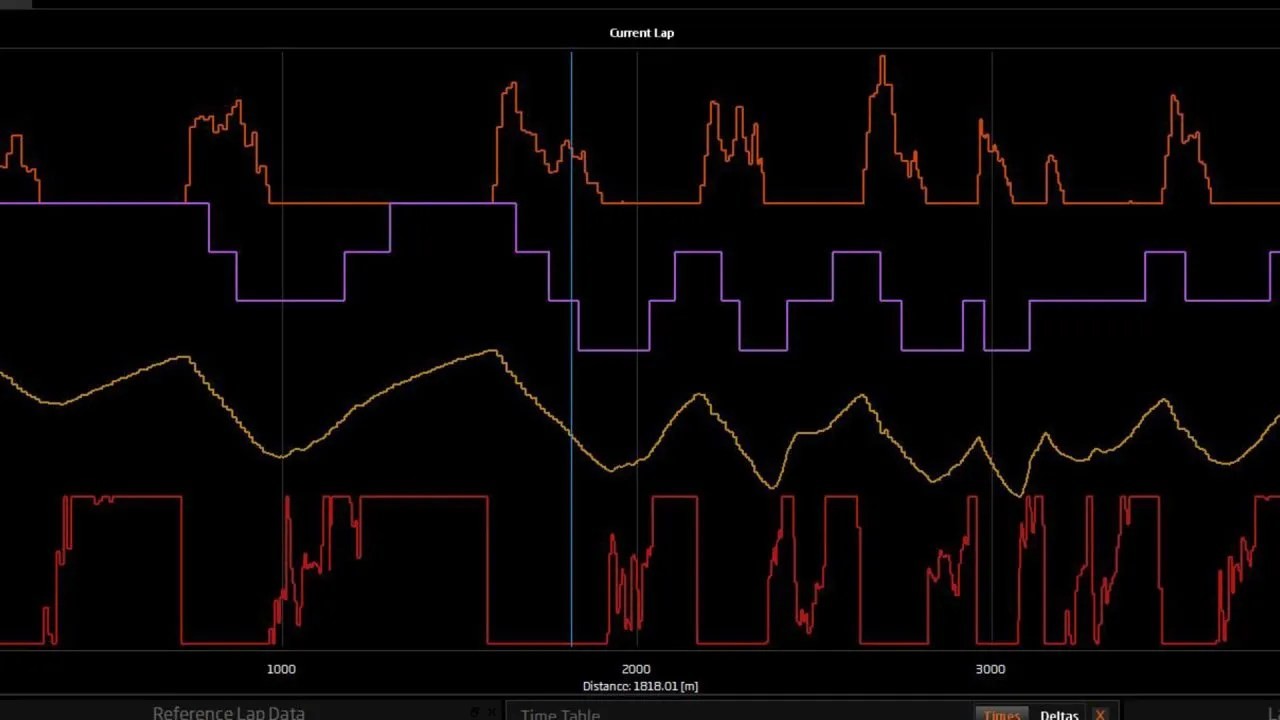
Data plots are graphical representations of the data recorded by the data logger. They allow you to visualize the data and identify trends and patterns. Common types of data plots include:
- Time Series Plots: Show how a parameter changes over time.
- X-Y Plots: Show the relationship between two parameters.
- Histograms: Show the distribution of a parameter.
4.2. Calculating Statistics
Calculating statistics can help you quantify the data and identify key trends. Common statistics include:
- Average: The average value of a parameter.
- Maximum: The maximum value of a parameter.
- Minimum: The minimum value of a parameter.
- Standard Deviation: A measure of the variability of a parameter.
4.3. Identifying Key Events
Identifying key events can help you focus your analysis on the most important parts of the data. Key events might include:
- Braking Points: Points where the driver applies the brakes.
- Corner Entry: Points where the car enters a corner.
- Corner Exit: Points where the car exits a corner.
- Gear Changes: Points where the driver changes gears.
5. Advanced Data Analysis Techniques
In addition to basic data analysis techniques, you can use advanced techniques to gain deeper insights into your race car’s performance. These techniques include using math channels, frequency analysis, and lap time simulation.
5.1. Using Math Channels
Math channels are calculated channels that are derived from the raw data channels. They allow you to calculate new parameters that are not directly measured by the sensors. Common math channels include:
- Wheel Speed: Calculated from the wheel speed sensors.
- Slip Angle: Calculated from the wheel speed and steering angle.
- Lateral Acceleration: Calculated from the accelerometer data.
5.2. Frequency Analysis
Frequency analysis is a technique used to identify the dominant frequencies in the data. This can be useful for identifying vibration problems or other issues that are affecting the car’s performance.
5.3. Lap Time Simulation
Lap time simulation is a technique used to predict the lap time of a race car based on its performance data. This can be useful for evaluating different car setups or driving strategies.
6. Analyzing Driver Performance
In addition to analyzing the car’s performance, data analysis can also be used to analyze driver performance. This involves examining parameters such as steering angle, throttle position, and braking force to identify areas where the driver can improve their driving technique.
6.1. Steering Analysis
Steering analysis involves examining the driver’s steering inputs to identify areas where they can improve their steering technique. This might include:
- Reducing Steering Corrections: Smooth and minimal steering inputs are generally more efficient.
- Optimizing Steering Angle: Using the correct steering angle for each corner.
- Avoiding Oversteering: Preventing the car from sliding out of control.
6.2. Throttle Analysis
Throttle analysis involves examining the driver’s throttle inputs to identify areas where they can improve their throttle technique. This might include:
- Smooth Throttle Application: Applying the throttle smoothly and gradually.
- Avoiding Wheelspin: Preventing the wheels from spinning.
- Optimizing Throttle Position: Using the correct throttle position for each situation.
6.3. Braking Analysis
Braking analysis involves examining the driver’s braking inputs to identify areas where they can improve their braking technique. This might include:
- Optimizing Braking Points: Braking at the optimal point for each corner.
- Smooth Brake Release: Releasing the brakes smoothly and gradually.
- Avoiding Lockup: Preventing the wheels from locking up.
7. Analyzing Car Setup
Data analysis can also be used to optimize the car’s setup for a particular track or driving style. This involves examining parameters such as suspension travel, tire pressure, and aerodynamic forces to identify areas where the car’s setup can be improved.
7.1. Suspension Analysis
Suspension analysis involves examining the suspension travel data to identify areas where the suspension setup can be improved. This might include:
- Optimizing Spring Rates: Selecting the appropriate spring rates for the track and driving style.
- Optimizing Damper Settings: Adjusting the damper settings to control the suspension movement.
- Optimizing Ride Height: Setting the correct ride height for the track conditions.
7.2. Tire Analysis
Tire analysis involves examining the tire pressure and temperature data to identify areas where the tire setup can be improved. This might include:
- Optimizing Tire Pressure: Setting the correct tire pressure for the track conditions and driving style.
- Monitoring Tire Temperature: Ensuring that the tire temperature is within the optimal range.
- Analyzing Tire Wear: Identifying areas of excessive tire wear.
7.3. Aerodynamic Analysis
Aerodynamic analysis involves examining the aerodynamic forces acting on the car to identify areas where the aerodynamic setup can be improved. This might include:
- Optimizing Wing Angles: Adjusting the wing angles to generate the optimal amount of downforce.
- Adjusting Ride Height: Adjusting the ride height to optimize the aerodynamic performance.
- Analyzing Airflow: Examining the airflow around the car to identify areas of drag.
 Close-up of a race car tire
8. Case Studies in Race Car Data Analysis
To illustrate the power of race car data analysis, let’s examine a few case studies.
8.1. Improving Lap Time Through Brake Optimization
In one case study, a race team used data analysis to improve their lap time by optimizing their braking technique. By examining the braking force data, they identified that the driver was braking too early in certain corners. By delaying their braking point, they were able to carry more speed into the corners and reduce their lap time by several tenths of a second.
8.2. Enhancing Handling with Suspension Adjustments
In another case study, a race team used data analysis to improve their car’s handling by adjusting the suspension setup. By examining the suspension travel data, they identified that the car was bottoming out in certain corners. By increasing the spring rates and damper settings, they were able to prevent the car from bottoming out and improve its handling.
8.3. Diagnosing Mechanical Issues Through Data Trends
In yet another case study, a race team used data analysis to diagnose a mechanical issue with their car. By examining the engine RPM data, they noticed that the engine was losing power at high RPMs. Further investigation revealed that the fuel pump was failing, and replacing it resolved the issue.
9. Common Pitfalls to Avoid in Data Analysis
While data analysis can be a powerful tool, it’s essential to avoid common pitfalls that can lead to incorrect conclusions. These pitfalls include:
9.1. Data Overload
Collecting too much data can be overwhelming and make it difficult to identify the key trends. Focus on collecting the most relevant data for your application.
9.2. Incorrect Sensor Calibration
Incorrect sensor calibration can lead to inaccurate data. Ensure that all sensors are properly calibrated before collecting data.
9.3. Ignoring Data Quality
Data quality is crucial for accurate analysis. Ensure that the data is free from noise and errors.
9.4. Jumping to Conclusions
Avoid jumping to conclusions based on limited data. Always analyze the data thoroughly and consider all possible explanations.
10. The Future of Race Car Data Analysis
The field of race car data analysis is constantly evolving, with new technologies and techniques emerging all the time. Some of the trends shaping the future of race car data analysis include:
10.1. Artificial Intelligence and Machine Learning
AI and machine learning are being used to automate the data analysis process and identify patterns that would be difficult for humans to detect.
10.2. Cloud-Based Data Analysis
Cloud-based data analysis platforms are making it easier to store, process, and share data with team members.
10.3. Real-Time Data Analysis
Real-time data analysis is allowing teams to make decisions during races based on live data.
11. Ethical Considerations in Data Analysis
As data analysis becomes more sophisticated, it is important to consider the ethical implications of using this technology in racing. This includes issues such as:
11.1. Data Privacy
Protecting the privacy of driver and team data is crucial. Ensure that data is stored securely and used responsibly.
11.2. Fair Competition
Using data analysis to gain an unfair advantage over competitors can be unethical. Follow the rules and regulations of the racing series.
11.3. Transparency
Be transparent about how data analysis is being used and avoid hiding information from competitors.
12. Resources for Further Learning
To deepen your understanding of race car data analysis, consider exploring the following resources:
12.1. Books
- Analysis Techniques for Racecar Data Acquisition by Jorge Segers
- A Practical Guide to Race Car Data Analysis by Bob Bondurant
- Making Sense of Squiggly Lines by Christopher Brown
- Competition Car Data Logging by Malcolm McDonald
- Data Power: Using Racecar Data Acquisition by Buddy Fey
12.2. Online Courses
- MoTeC Training Courses
- Aim Training Courses
- SAE International Seminars
12.3. Professional Organizations
- SAE International
- Motorsport UK
- FIA Institute
13. Practical Applications in Sim Racing
The principles of race car data analysis aren’t confined to real-world racing; they are equally applicable in sim racing. Sim racers can use data analysis tools to improve their performance, car setups, and driving techniques in virtual environments.
13.1. Utilizing Sim Racing Telemetry
Many sim racing platforms provide telemetry data that mirrors real-world racing, including information on speed, braking, throttle, steering, and suspension.
13.2. Software Compatibility
Tools like iSpeed for iRacing and similar telemetry loggers for other sims allow racers to export and analyze data, providing insights into their driving habits.
13.3. Applying Real-World Techniques to Virtual Racing
By applying the same analysis techniques used in real racing, sim racers can fine-tune car setups, optimize braking points, and improve overall consistency.
14. Expert Insights on Data-Driven Racing
Insights from seasoned race engineers and drivers emphasize the importance of data in modern racing. Their experiences highlight how data analysis has revolutionized performance optimization.
14.1. The Engineer’s Perspective
Race engineers rely on data to make informed decisions about car setup, tire management, and strategy, emphasizing that “blind guesses” are no longer acceptable.
14.2. The Driver’s Perspective
Drivers use data to refine their driving techniques, understand how they can improve their cornering speeds, and consistently hit their braking points.
14.3. Collaborative Analysis
The best results come from collaboration between engineers and drivers, where both parties work together to interpret data and identify areas for improvement.
15. Building a Data-Driven Racing Team
Creating a data-driven culture within a racing team is essential for sustained success. This involves investing in the right tools, training personnel, and fostering a culture of continuous improvement.
15.1. Investing in Data Acquisition Systems
The foundation of a data-driven team is a reliable and accurate data acquisition system, including sensors, data loggers, and analysis software.
15.2. Training and Education
Team members, including engineers and drivers, should receive training in data analysis techniques, enabling them to effectively interpret data and make informed decisions.
15.3. Continuous Improvement
A data-driven team should embrace a culture of continuous improvement, constantly seeking ways to refine their processes and improve their performance based on data insights.
16. Data Analysis in Different Racing Disciplines
The principles of data analysis apply across various racing disciplines, from Formula 1 to stock car racing, but the specific parameters and techniques may vary.
16.1. Formula 1
In Formula 1, data analysis is highly sophisticated, with teams collecting vast amounts of data on every aspect of the car’s performance, from aerodynamics to engine management.
16.2. Stock Car Racing
In stock car racing, data analysis focuses on optimizing car setup for oval tracks, including suspension settings, tire management, and engine performance.
16.3. Rally Racing
Rally racing presents unique challenges for data analysis, as teams must analyze data from diverse and unpredictable terrains, focusing on suspension performance, traction control, and driver inputs.
17. Practical Tips for Beginners
For those just starting out with race car data analysis, here are some practical tips to help you get started:
17.1. Start with the Basics
Begin by understanding the fundamental principles of data analysis, including data acquisition, sensor technology, and basic analysis techniques.
17.2. Focus on Key Parameters
Focus on analyzing a few key parameters that have the most significant impact on performance, such as speed, braking, and throttle position.
17.3. Visualize the Data
Use data visualization tools to create graphs and charts that make it easier to identify trends and patterns in the data.
18. The Future of Driverless Racing and Data
The rise of driverless racing brings new dimensions to data analysis, as algorithms and AI take over the driving task.
18.1. AI-Driven Optimization
In driverless racing, AI algorithms analyze data in real-time to optimize car performance, adjust driving strategies, and make split-second decisions.
18.2. Enhanced Data Collection
Driverless cars can collect even more data than human-driven cars, including information on the car’s internal systems, the environment, and the behavior of other vehicles.
18.3. The Role of Human Engineers
Despite the rise of AI, human engineers will still play a critical role in driverless racing, analyzing data, refining algorithms, and ensuring that the cars are performing optimally.
19. FAQs About Race Car Data Analysis
Here are some frequently asked questions about race car data analysis:
1. What is race car data analysis?
Race car data analysis is the process of systematically examining information gathered during testing or racing to improve performance.
2. Why is data analysis important in racing?
Data analysis helps engineers fine-tune the car’s setup, enhances driver technique, increases speed and consistency, and reduces the risk of mechanical failure.
3. What are the key metrics to analyze in race car data?
Key metrics include speed, acceleration, braking force, throttle position, steering angle, suspension travel, engine RPM, and tire pressure and temperature.
4. What tools and technologies are used for data analysis?
Essential tools include data loggers, sensors, and software for data analysis and visualization, such as MoTeC i2 Pro, Aim Race Studio 3, and VBOX Test Suite.
5. How can data analysis improve driver performance?
Data analysis can identify areas where the driver can improve their driving technique, such as steering smoothness, throttle control, and braking efficiency.
6. What is the role of math channels in data analysis?
Math channels are calculated channels derived from raw data, allowing you to calculate new parameters not directly measured by sensors, such as wheel speed and slip angle.
7. What are some common pitfalls to avoid in data analysis?
Common pitfalls include data overload, incorrect sensor calibration, ignoring data quality, and jumping to conclusions.
8. How is AI and machine learning being used in race car data analysis?
AI and machine learning automate data analysis, identify patterns difficult for humans to detect, and enable real-time decision-making.
9. How does data analysis differ across different racing disciplines?
Data analysis varies depending on the discipline, with Formula 1 focusing on extensive aerodynamic data, stock car racing on oval track optimization, and rally racing on diverse terrain conditions.
10. What ethical considerations are involved in data analysis?
Ethical considerations include data privacy, fair competition, and transparency in how data analysis is used.
20. Conclusion: Embracing Data for Racing Success
Embracing data analysis is essential for achieving success in modern racing. By understanding the principles, using the right tools, and avoiding common pitfalls, you can unlock valuable insights that will help you improve your car’s performance, refine your driving technique, and gain a competitive edge. Visit CONDUCT.EDU.VN for more detailed guides and resources to master race car data analysis and elevate your racing game. For additional support, contact us at 100 Ethics Plaza, Guideline City, CA 90210, United States. Reach out via Whatsapp at +1 (707) 555-1234, or visit our website: CONDUCT.EDU.VN. Let conduct.edu.vn be your trusted partner in navigating the world of ethical conduct.