Business dashboards offer a streamlined approach to understanding complex data, and CONDUCT.EDU.VN provides the resources to master them. Data visualization transforms raw figures into actionable insights, empowering informed decisions through interactive dashboards and comprehensive data analytics. Explore the essence of dashboard solutions and KPI dashboards to elevate your business intelligence.
1. Understanding Business Dashboards: An Overview
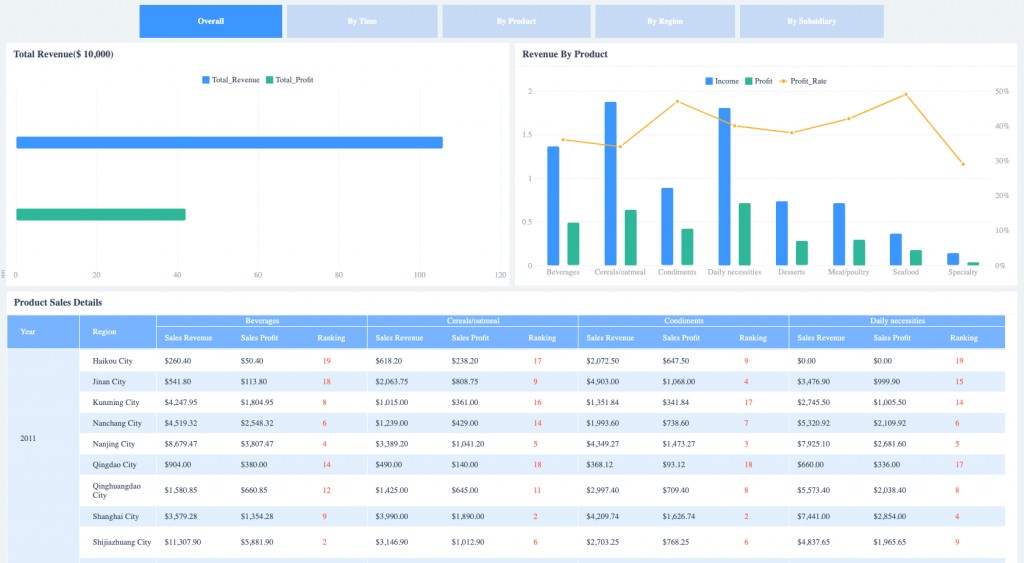
A business dashboard is a visual interface that displays key performance indicators (KPIs) and other critical data points, offering a real-time snapshot of an organization’s performance. Think of it as the instrument panel of a car, providing essential information at a glance. Business dashboards extract meaningful insights from raw data, presenting a digestible view of performance to facilitate strategic decision-making. Business reports complement dashboards by providing detailed analyses and trends, offering executives and stakeholders a comprehensive understanding of business operations.
Essentially, business managers gain access to all the vital data needed for informed decisions through a single, unified interface. The business dashboard uses various charts and graphs, such as speedometers, column charts, and radar plots, to visually represent KPIs, enabling managers to monitor business operations, identify potential issues, and conduct in-depth data analysis.
2. Essential Features of a Business Dashboard
A well-designed business dashboard should offer a range of features to maximize its effectiveness. Here are some of the key characteristics:
- Comprehensive Customization: Tailor your dashboard to align with your company’s branding by customizing fonts, colors, and layouts.
- Predefined Dashboard Themes: Save custom themes for quick access or choose from a library of pre-designed themes.
- Extensive Library: Access a wide range of dashboard examples with specific KPIs tailored to various functions and industries.
- Advanced Charting Capabilities: Incorporate secondary axes or combine multiple chart types for deeper insights.
- Widget Linking: Connect disparate data sources by linking widgets to related content, such as other dashboards, websites, or resources.
- Time Interval Widget: Drill down into data based on different time scales (daily, weekly, monthly) without cluttering the dashboard.
- Multiple Sharing Options: Share dashboards internally or externally through public URLs or automated email reports.
- Embedded Analytics: Integrate dashboards into your intranet, website, or app and customize them to match your brand.
- 24/7 Availability: Access dashboards anytime, anywhere, ensuring real-time insights.
Modern business intelligence (BI) software should provide these features, ensuring accessibility and actionable insights.
3. Types of Business Dashboards: Strategic, Analytical, and Operational
Business dashboards can be categorized into three main types based on their strategic function:
3.1 Strategic Dashboard
The strategic dashboard provides a high-level overview of the company’s operations, enabling users to quickly understand performance and make informed decisions. It focuses on summarizing past performance and formulating future strategic goals. Real-time data is not always necessary; instead, it emphasizes a simple visual representation of critical information.
This type of dashboard helps managers report results and align departments toward common goals. Think of it as the cockpit of a car or airplane, providing managers with a clear understanding of their current position and direction.
3.2 Analytical Dashboard
Analytical dashboards allow managers to explore surface-level information and delve into the underlying causes of observed trends. Through data drilling, linking, and filtering, users can identify the root causes of problems. For example, analyzing declining sales performance or extended payment times. These dashboards serve middle-level managers, aiding in tactical execution.
The design needs to directly reflect problems, prioritize them, and correlate them with actionable steps. An analytical dashboard can be strategic or operational, differing mainly in the level of detail provided. It often includes a comparison of time-based data between multiple factors and variables.
3.3 Operational Dashboard
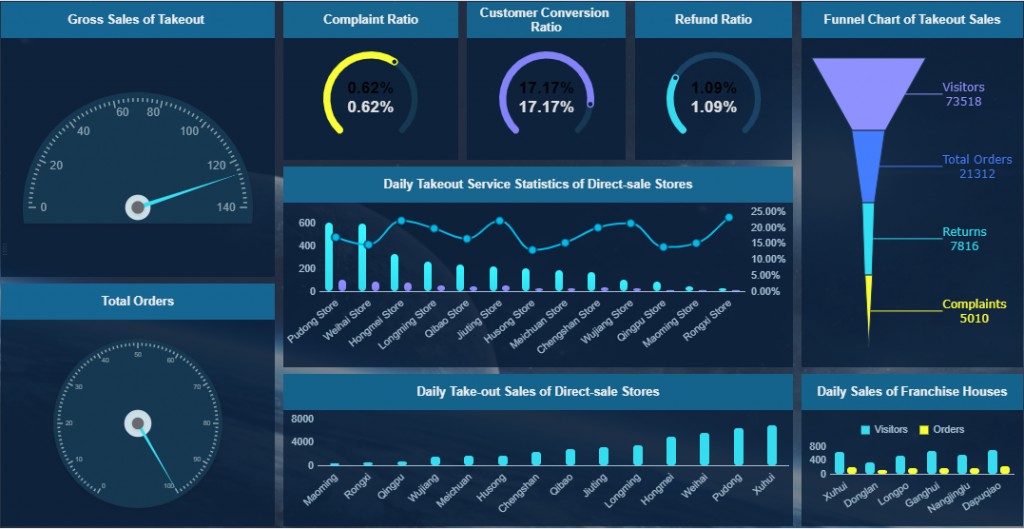
Operational dashboards emphasize continuous, real-time reporting, providing up-to-the-minute insights into daily progress and output. These dashboards ensure that the expected plan aligns with the actual performance, breaking down strategic goals into daily tasks. They enable prompt problem-solving and incremental performance improvements.
The design of operational dashboards should focus on business needs, providing reminders, monitoring, and early warning functions.
- KPI Monitoring: Track key performance indicators to control overall operations, displaying core indicators through charts and tables.
- Threshold Warning: Implement early warning systems with background highlighting and tachometers to alert users to potential issues.
- Real-Time Data Monitoring: Monitor key indicators in real-time for industries such as finance, transportation, and logistics.
4. Business Dashboard Templates: Examples and Applications
Business dashboard templates are tailored for various industries and roles. Executives at different levels prioritize different key information, with sales executives focusing on sales dashboards and finance executives concentrating on financial dashboards. Dashboard design also varies across industries, including manufacturing, retail, transportation, and government.
Here are a few examples:
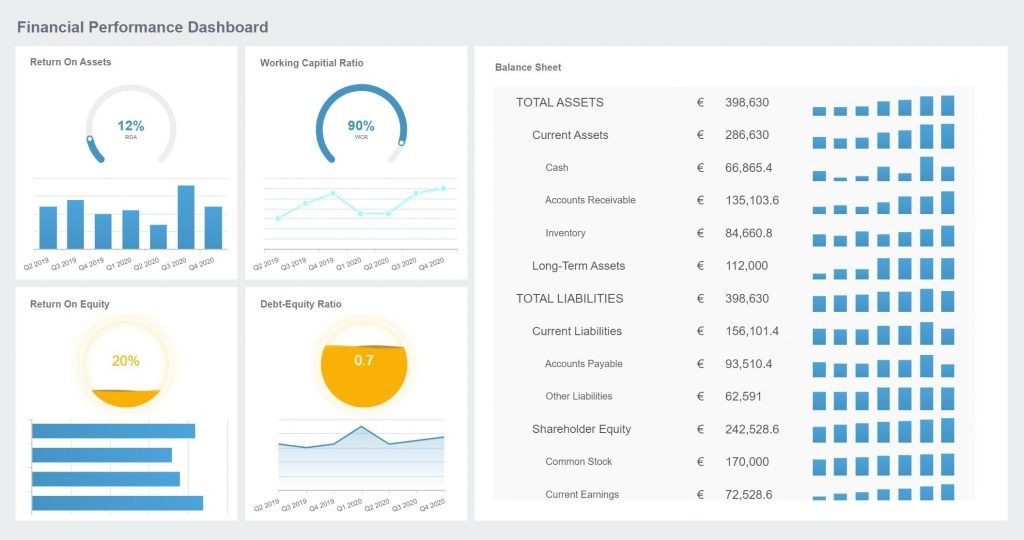
4.1 Financial Dashboard Template
Financial performance is a critical measure of business success. A financial dashboard visualizes key financial metrics, providing an intuitive interface for monitoring financial performance. This helps the financial sector view key indicators efficiently.
DuPont analysis, which uses return on investment to analyze a company’s financial status, is often integrated into financial dashboards.
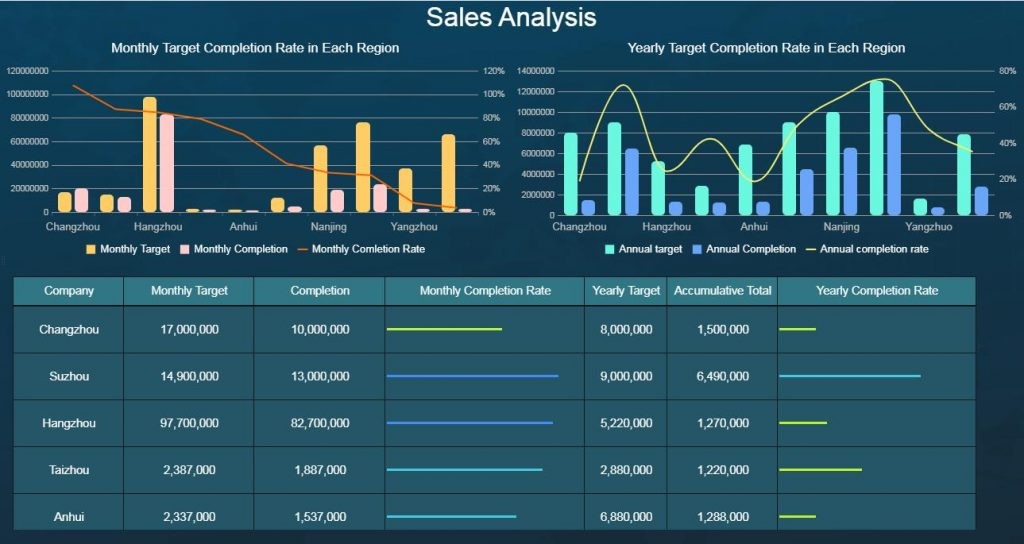
4.2 Sales Dashboard Template
A sales leaderboard on a sales dashboard is an effective way to track individual sales performance and motivate teams. By viewing and comparing multiple sales indicators and KPIs, you can identify top performers and foster healthy competition.
4.3 Marketing Dashboard Template
A marketing dashboard consolidates all useful marketing information in one place, replacing the decentralized model of manual compilation. This provides a comprehensive view of marketing performance.
4.4 Education Dashboard Template
Designed for schools to manage student return and ensure health and safety during various situations.
[CONDUCT.EDU.VN] helps schools manage various situations and provide guidance on maintaining a safe and healthy educational environment.
5. Benefits of Business Dashboards: Clarity, Visibility, and Efficiency
Well-designed business intelligence dashboards offer numerous benefits:
Make Key Metrics Clear
Dashboards highlight various business metrics, enabling users to quickly find the information they need. By visualizing key metrics, business dashboards provide clarity and support informed decision-making.
Stick to Visibility
Data visualization is a key benefit of business dashboards. Transforming large amounts of data into dynamic charts and graphs makes it easier to understand trends and patterns.
Time-Saving
Business dashboards present key insights in an automated, real-time manner, saving employees time on data collection and reporting. The “7-11 rule” suggests that readers should be able to grasp important information in just 7-11 seconds.
Make Work Less Tedious
By filtering out unnecessary information and using visualization to maintain employee attention, business dashboards make work less tedious. Interactive dashboards can keep employees interested and motivated.
Improve Working Efficiency
Business dashboards improve work efficiency by saving time and providing easy access to key data. Employees in different departments can access the information they need without interrupting others.
6. Business Dashboard Software: Selecting the Right Tool
Numerous software options provide business dashboard capabilities. When selecting a business dashboard software, consider factors such as ease of use, functionality, and cost. Some popular options include:
- Tableau
- Power BI
- FineReport
- Qlik Sense
- Sisense
Each platform offers unique features and capabilities, so it’s essential to evaluate your specific needs and choose the software that best meets them.
7. Steps to Create Effective Business Dashboards
Creating effective business dashboards involves several key steps.
Step 1: Define Your Objectives
Clearly define the goals you want to achieve with your dashboard. What key performance indicators (KPIs) do you need to track? What questions do you need to answer?
Step 2: Identify Your Audience
Consider who will be using the dashboard. Different users may have different needs and levels of technical expertise.
Step 3: Choose the Right Data
Select the data that is most relevant to your objectives and audience. Avoid including unnecessary data that can clutter the dashboard.
Step 4: Select Appropriate Visualizations
Choose the right types of charts and graphs to effectively display your data. Consider using bar charts, line charts, pie charts, scatter plots, and maps, depending on the data and the message you want to convey.
Step 5: Design for Clarity and Usability
Organize the dashboard in a logical and intuitive way. Use clear labels and titles. Avoid using too many colors or visual elements that can distract from the data.
Step 6: Make It Interactive
Add interactive elements, such as filters, drill-downs, and tooltips, to allow users to explore the data in more detail.
Step 7: Test and Refine
Test the dashboard with real users and gather feedback. Refine the dashboard based on the feedback you receive.
Here’s a table summarizing best practices in dashboard creation:
| Best Practice | Description |
|---|---|
| Define Objectives | Clearly outline the goals and KPIs. |
| Identify Audience | Tailor the dashboard to meet user needs. |
| Choose Relevant Data | Select data directly related to objectives. |
| Appropriate Visuals | Use chart types that effectively represent data. |
| Design for Clarity | Organize logically with clear labels. |
| Add Interactivity | Include filters, drill-downs for exploration. |
| Test and Refine | Gather user feedback to improve design. |


8. Advanced Tips for Business Dashboards
Beyond the basics, here are some advanced tips to elevate your business dashboard:
- Data Storytelling: Weave a narrative with your data, guiding the user through insights and discoveries.
- Predictive Analytics: Integrate predictive models to forecast future trends and outcomes.
- Mobile Optimization: Ensure your dashboard is responsive and accessible on mobile devices.
- Custom Alerts: Set up custom alerts to notify users of critical changes in data.
9. Common Mistakes to Avoid
Creating an effective business dashboard requires careful planning and execution. Here are some common mistakes to avoid:
- Clutter and Complexity: Overloading the dashboard with too much information can overwhelm users.
- Poor Visualization Choices: Using inappropriate chart types can obscure data insights.
- Lack of Context: Failing to provide context for data points can lead to misinterpretations.
- Ignoring User Feedback: Neglecting user feedback can result in a dashboard that doesn’t meet user needs.
10. Business Dashboards and Data Security
When working with business dashboards, data security is paramount. Implement the following measures to protect sensitive information:
- Access Controls: Restrict access to dashboards based on user roles and permissions.
- Data Encryption: Encrypt data both in transit and at rest.
- Regular Audits: Conduct regular security audits to identify and address vulnerabilities.
- Compliance: Ensure compliance with relevant data privacy regulations, such as GDPR and CCPA.
11. Business Dashboard Examples Across Industries
Business dashboards find applications across various industries. Let’s explore a few examples:
- Healthcare: Tracking patient outcomes, hospital bed occupancy, and operational efficiency.
- Retail: Monitoring sales trends, inventory levels, and customer behavior.
- Manufacturing: Analyzing production output, machine uptime, and quality control metrics.
- Finance: Tracking financial performance, investment returns, and risk exposure.
12. Integrating Dashboards with Other Business Systems
To maximize the value of business dashboards, integrate them with other business systems, such as:
- CRM (Customer Relationship Management): Combine sales and marketing data for a comprehensive view of customer interactions.
- ERP (Enterprise Resource Planning): Integrate financial, supply chain, and operational data.
- HRM (Human Resource Management): Analyze employee performance, attrition rates, and recruitment metrics.
13. Future Trends in Business Dashboards
The field of business dashboards is constantly evolving. Here are some future trends to watch out for:
- AI-Powered Insights: Integration of artificial intelligence to automate data analysis and generate actionable insights.
- Augmented Reality (AR): Overlaying dashboard data onto the real world for enhanced visualization.
- Natural Language Processing (NLP): Interacting with dashboards using natural language queries.
- Real-Time Collaboration: Collaborative dashboarding, allowing teams to work together on data analysis in real-time.
14. Maximizing ROI with Business Dashboards
Business dashboards can provide a significant return on investment (ROI). By providing real-time insights, dashboards enable organizations to make better decisions, improve efficiency, and drive growth.
Here are some ways to maximize ROI with business dashboards:
- Focus on Key Performance Indicators (KPIs): Prioritize the KPIs that are most critical to your business.
- Track Progress: Regularly monitor your progress toward your goals and adjust your strategy as needed.
- Empower Users: Provide users with the training and support they need to effectively use dashboards.
15. Business Dashboard for Startups
For startups, business dashboards are particularly valuable. They can provide real-time insights into key metrics, such as:
- Customer Acquisition Cost (CAC): The cost of acquiring a new customer.
- Customer Lifetime Value (CLTV): The total revenue a customer is expected to generate.
- Burn Rate: The rate at which a startup is spending its cash reserves.
These insights can help startups make better decisions about marketing, sales, and product development.
16. Choosing the Right Charts for Your Dashboard
Selecting the correct chart type is crucial for conveying data effectively. Different chart types serve different purposes:
- Bar Charts: Compare values across categories.
- Line Charts: Show trends over time.
- Pie Charts: Display proportions of a whole.
- Scatter Plots: Illustrate relationships between two variables.
- Maps: Visualize data across geographic regions.
Consider the type of data you’re working with and the message you want to convey when choosing a chart type.
17. Best Practices for Data Integration in Business Dashboards
Integrating data from multiple sources into a business dashboard can be challenging. Here are some best practices to follow:
- Data Cleansing: Cleanse and transform data to ensure accuracy and consistency.
- Data Modeling: Create a data model that defines the relationships between different data sources.
- ETL Processes: Use ETL (Extract, Transform, Load) processes to extract data from source systems, transform it into a usable format, and load it into the dashboard.
- Data Governance: Implement data governance policies to ensure data quality and security.
18. The Role of Mobile Dashboards
Mobile dashboards are becoming increasingly important as more and more people access data on mobile devices. When designing mobile dashboards, keep the following in mind:
- Simplicity: Keep the dashboard simple and easy to use on a small screen.
- Responsiveness: Ensure the dashboard is responsive and adapts to different screen sizes.
- Touch-Friendly: Design the dashboard for touch input.
19. User Training and Adoption
To ensure successful adoption of business dashboards, provide users with adequate training. Training should cover:
- Dashboard Navigation: How to navigate the dashboard and find the information they need.
- Data Interpretation: How to interpret the data displayed on the dashboard.
- Interactive Features: How to use interactive features, such as filters and drill-downs.
- Troubleshooting: How to troubleshoot common problems.
20. Building a Data-Driven Culture with Business Dashboards
Business dashboards can play a key role in building a data-driven culture within an organization. By providing easy access to data, dashboards empower employees to make better decisions based on facts rather than intuition.
To foster a data-driven culture, encourage employees to use dashboards to:
- Monitor Performance: Track progress toward goals.
- Identify Trends: Spot emerging trends and opportunities.
- Solve Problems: Analyze data to identify the root causes of problems.
- Make Decisions: Make informed decisions based on data.
21. Business Dashboards and Compliance
In many industries, compliance with regulations is essential. Business dashboards can help organizations monitor compliance with regulations by:
- Tracking Key Metrics: Monitoring metrics related to compliance requirements.
- Generating Reports: Automatically generating reports for regulatory agencies.
- Identifying Risks: Spotting potential compliance risks.
22. Measuring Dashboard Effectiveness
To determine whether a business dashboard is effective, measure its impact on key business metrics. Track:
- Decision-Making Speed: How quickly decisions are made.
- Process Efficiency: How efficiently processes are executed.
- Business Outcomes: Improvements in key business outcomes.
23. The Future of Data Visualization
Data visualization is a constantly evolving field. Future trends in data visualization include:
- Immersive Visualizations: Using virtual reality (VR) and augmented reality (AR) to create immersive data experiences.
- AI-Driven Visualizations: Using artificial intelligence to automatically generate visualizations based on data.
- Interactive Storytelling: Creating interactive data stories that allow users to explore data in a narrative format.
24. Security Best Practices for Business Dashboards
Data security is crucial. Implement these security measures:
- Authentication: Secure user authentication with strong passwords and multi-factor authentication.
- Authorization: Restrict access to sensitive data based on user roles.
- Data Encryption: Encrypt data at rest and in transit.
- Regular Audits: Conduct regular security audits to identify vulnerabilities.
25. FAQs on Business Dashboards
Here are some frequently asked questions about business dashboards:
- What is a business dashboard? A visual interface that displays key performance indicators (KPIs) and other critical data points.
- What are the benefits of using a business dashboard? Clarity, visibility, time-saving, improved efficiency, and data-driven decision-making.
- What are the different types of business dashboards? Strategic, analytical, and operational.
- How do I create an effective business dashboard? Define objectives, identify audience, choose relevant data, select appropriate visualizations, design for clarity, and test and refine.
- What software should I use to create a business dashboard? Tableau, Power BI, FineReport, Qlik Sense, and Sisense are popular options.
- How do I integrate data from multiple sources into a business dashboard? Use ETL processes, data modeling, and data cleansing.
- How do I ensure the security of my business dashboard? Implement authentication, authorization, data encryption, and regular audits.
- What are some common mistakes to avoid when creating a business dashboard? Clutter, poor visualization choices, lack of context, and ignoring user feedback.
- How do I measure the effectiveness of my business dashboard? Track decision-making speed, process efficiency, and business outcomes.
- What are the future trends in business dashboards? AI-powered insights, augmented reality, and natural language processing.
For more detailed guidance and resources on implementing best practices, visit CONDUCT.EDU.VN.
By understanding and implementing these guidelines, anyone can create a business dashboard to monitor critical performance indicators effectively.
Navigating the complexities of business data can be challenging, but CONDUCT.EDU.VN offers the guidance and resources you need. Our comprehensive materials cover everything from dashboard design to data security, empowering you to make informed decisions and drive success.
Ready to transform your data into actionable insights? Visit CONDUCT.EDU.VN today to explore our extensive collection of articles, templates, and resources. Let us help you unlock the power of your data and achieve your business goals.
Address: 100 Ethics Plaza, Guideline City, CA 90210, United States
Whatsapp: +1 (707) 555-1234
Website: conduct.edu.vn