Volume Price Analysis (VPA) is a powerful technique used to understand market dynamics by analyzing the relationship between price movement and trading volume. This guide provides a comprehensive summary of VPA, drawing insights from Anna Coulling’s book and expanding on key concepts. VPA helps traders identify potential trading opportunities by revealing the forces of supply and demand in the market.
The Foundation of Volume Price Analysis
Coulling’s work builds upon the principles of legendary traders like Edwin Lefevre and Richard Wyckoff, emphasizing that the core concepts of market analysis remain relevant across time. Understanding supply and demand, cause and effect, and the effort versus result relationship are fundamental to VPA. A key concept is that a breakout on high volume should be followed by a pullback on low volume, indicating coherent market behavior. Richard Ney’s work on market makers and manipulation also provides context for understanding the forces at play.
The Power of Volume
Volume is a crucial tool for understanding market maker activity and gaining an edge as a retail investor. Market makers, typically large institutions, have access to order flow information that retail investors lack. Volume provides insights into the balance of supply and demand, revealing the true strength or weakness behind price movements.
“Without volume, nothing moves, and if it does move and the volume is not in agreement, then there is something wrong, and an alarm bell sounds.” This highlights the importance of volume in validating price action. While tick volume isn’t perfect, it serves as a reliable proxy for actual volume, providing valuable information about market activity.
There are three main factors in Volume Analysis:
- Volume is relative: Volume is considered high or low with respect to the historic average volume of the underlying asset.
- Volume without price is meaningless: Volume must be analyzed in conjunction with price action to derive meaningful insights.
- Time is key: The quicker volume moves price action, the more significant it becomes.
VPA: An Art, Not a Science
VPA is a discretionary technique requiring extensive chart study and experience to master. Avoid relying on complex volume indicators and focus on understanding the underlying principles of volume price relationships.
First Principles of Volume Price Analysis
Chapter Four of Coulling’s book lays out the first principles of VPA:
- Art Not Science: VPA is an interpretive skill, not a rigid formula.
- Patience: Wait for confirmation of signals before acting. A signal is just a warning of a change.
- It’s All Relative: Volume is assessed relative to its historical context.
- Practice Makes Perfect: Mastery requires consistent observation and analysis.
- Technical Analysis: VPA is one tool to be used in conjunction with other methods.
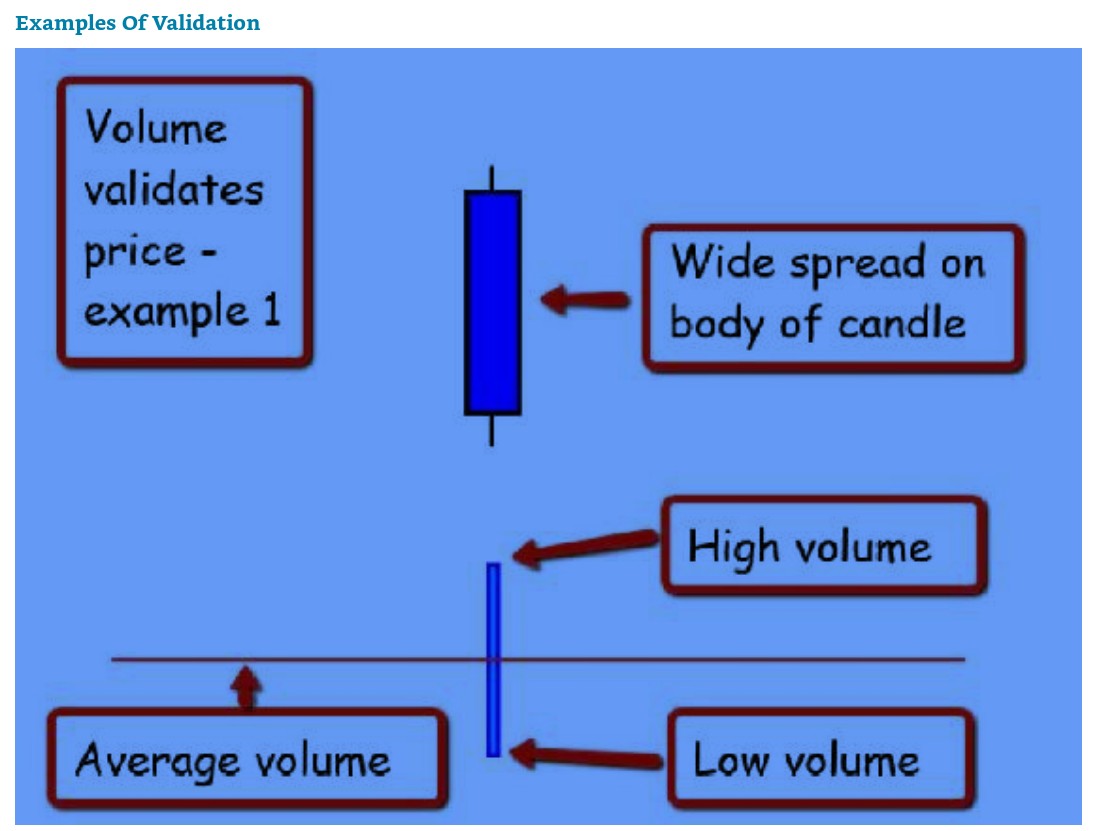
- Validation or Anomaly: Look for price action validated by volume or anomalies that signal potential changes. If the price is validated, it confirms a continuation of price behaviour. By contrast, if there is an anomaly, then this is sending a signal of a potential change. These are the only things we are constantly searching for in VPA.
This image shows an example of normal price-action. Wide spread candle-stick with widespread volume bar.
This example would be considered an anomally. High volume with narrow price-action.
For traders it is easy to identify normal price-action and volume. Here are more abnormalities outlined in Coullings book:
Here’s an example of abnormal price action where: Candle 2 – narrow candle with high volume, Candle 3 – high spread on candle with lower volume, and Candle 4 – high spread candle with very low volume. These are signals that this is abnormal price-action.
The analysis includes Micro (analyze each price candle as it arrives, and look for validation or anomaly using volume), Macro (analyze each price candle against the context of the last few candles), and Global (analyze the complete chart with support and resistance).
Building the Picture: Key Concepts
Coulling identifies five core concepts that are at the heart of VPA:
- Accumulation: Insiders are accumulating positions before a price increase.
- Distribution: Insiders are distributing positions before a price decrease.
- Testing: Insiders are testing the market for supply or demand.
- Selling Climax: A sharp sell-off with high volume, indicating potential exhaustion of selling pressure.
- Buying Climax: A sharp rally with high volume, indicating potential exhaustion of buying pressure.
Market testing helps the author breaks down the intricacies of these market cycles down to the LAST candlestick.
In this example, during a bullish trend, price can pullback and re-test previous areas of support, in this case, a LOW volume pullback confirms the trend.
What you don´t want to see is a high volume pullback with a wide candle, which indicates strong selling in an uptrend.
Insiders use testing in all markets. It’s a simple concept that sends a clear message that the market is about to break out and move higher.
This chart illustrates how the candlesticks and volume can help confirm the end/beginning of a cycle.
This is the full market cycle explained in one image.
VPA: The Next Level – Candle Analysis
Candlestick patterns combined with volume analysis provide powerful insights into market sentiment. Coulling outlines key principles for interpreting candlesticks:
- Wick Length: Reveals potential strength, weakness, and indecision.
- No Wick: Signals strong market sentiment in the direction of the closing price.
- Body Size: A narrow body indicates weak market sentiment, while a wide body represents strong market sentiment.
- Context: The meaning of a candle depends on its location within a price trend.
- Volume Validation: Volume validates price action, confirming or contradicting the signal.
Shooting star candles appear in every trend, both bullish and bearish, and at every point within the trend.
Context is important and managing risk in real-time. The more shooting stars appear , the better.
Hammer Candle: Classic candle of strength.
If we do see the hammer candle at the top of a bullish trend, it has a different name, and a completely different interpretation.
The Long Legged Doji Candle:
The long legged doji can signal a reversal from bearish to bullish, or bullish to bearish, and the change in direction depends on the preceding price action.
The Hanging Man:
Candle Price action – potential weakness after bullish trend.
Stopping Volume:
Price action – strength.
Topping Volume:
Price action – weakness.
Support, Resistance, and Trendlines
Support and resistance levels, driven by supply and demand, are fundamental to VPA. These areas represent price congestion where the market is likely to find support or encounter resistance. They define barriers where the market has paused or reversed.
Volume at Price (VAP)
The Volume at Price (VAP) indicator identifies price levels with the highest traded volume. These high-volume areas often act as support or resistance. If the price trades past a high-volume area, it can signal a buying or selling opportunity in that direction.
This technique uses volume bars on the chart to indentify price areas with the largest traded volume. If price trades PAST that high volume area (which is either a support or resistance) than you can find an edge buying/selling in that direction.
Putting It All Together
Combining the key ideas, this summary explains the process of volume price analysis, providing a guide that breaks down the details of how volume creates attention to market dynamics.
Conclusion
Volume Price Analysis is a powerful tool for understanding market dynamics and identifying potential trading opportunities. While it requires practice and experience to master, the insights gained from analyzing the relationship between price and volume can significantly improve trading performance. By understanding the principles outlined in this complete guide, traders can gain a deeper understanding of market behavior and make more informed trading decisions.