Single-particle tracking (SPT) is a powerful technique for studying the dynamic behavior of molecules in living cells. Here, we delve into the validation and application of Spot-On, a method designed to accurately infer subpopulations and account for biases in SPT data. This guide highlights Spot-On’s capabilities through simulations and comparisons with other methods.
Simulated Data Analysis: Spot-On vs. Alternative Approaches
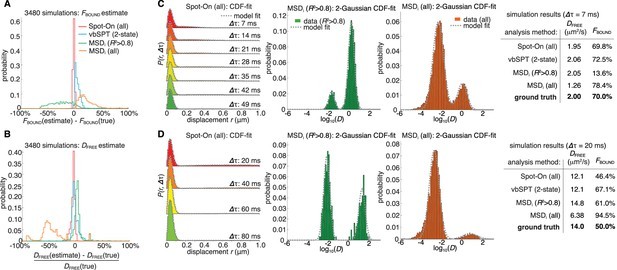
We initiated our evaluation by examining Spot-On’s ability to accurately infer subpopulations (Figure 1D) and correct for known biases (Figure 1C) using simulated data. Our benchmark included comparisons with a popular method involving fitting the mean square displacement (MSD) of individual trajectories (referred to as ‘MSDi’) and a sophisticated Hidden-Markov Model-based Bayesian inference method (vbSPT) (Persson et al., 2013).
To simulate realistic SPT experiments, we modeled transcription factor (TF) binding and diffusion dynamics within a mammalian nucleus (4 µm radius) under highly inclined illumination (HiLo) conditions (Tokunaga et al., 2008), incorporating a 25 nm localization error (Figure 3—figure supplement 1). This setup considered a 2-state model (‘bound vs. free’). We varied exposure time (1 ms, 4 ms, 7 ms, 13 ms, 20 ms), free diffusion constant (0.5 µm²/s to 14.5 µm²/s in 0.5 µm²/s increments), and bound fraction (0% to 95% in 5% increments), resulting in 3480 distinct conditions reflecting a broad range of biologically relevant dynamics (Figure 3—figure supplements 2–3; Appendix 1).
Accuracy and Limitations: A Closer Look at Spot-On’s Performance
Spot-On demonstrated accurate inference of subpopulation sizes with minimal error (Figure 3A–B, Table 1), while slightly underestimating the diffusion constant (−4.8%; Figure 3B; Table 1). This underestimation was attributed to particle confinement within the nucleus. When confinement was relaxed, Spot-On accurately inferred the diffusion constant (Figure 3—figure supplement 4; 20 µm nuclear radius). This underscores the importance of interpreting SPT-derived diffusion constants inside cells as apparent diffusion constants.
In contrast, the MSDi method struggled under most conditions, regardless of whether all trajectories (MSDi (all)) or a filtered subset (MSDi (R2 >0.8)) were used (Figure 3A–B; Table 1). vbSPT performed comparably to Spot-On for slow-diffusing proteins but exhibited larger deviations for fast-diffusing proteins (Figure 3—figure supplements 2–3).
To illustrate the discrepancies between methods, we analyzed two simulated scenarios (Figure 3C–D; more examples in Figure 3—figure supplement 3). In a scenario with a high bound fraction and slow diffusion (DFREE: 2.0 µm²/s; FBOUND: 70%; Δτ: 7 ms; Figure 3C), Spot-On and vbSPT accurately inferred both DFREE and FBOUND. However, MSDi (R2 > 0.8) significantly underestimated FBOUND (13.6% vs. 70%), while MSDi (all) slightly overestimated FBOUND. The sensitivity of MSDi-based methods to trajectory length and filtering thresholds was evident, with often less than 5% of trajectories meeting the criteria.
In a second example with a slow frame rate and fast diffusion, leading to rapid out-of-focus movement (DFREE: 14.0 µm²/s; FBOUND: 50%; Δτ: 20 ms; Figure 3D), Spot-On accurately inferred FBOUND and slightly underestimated DFREE due to nuclear confinement (Figure 3—figure supplement 4). vbSPT, lacking defocalization bias correction (developed for bacteria), overestimated FBOUND. Spot-On without defocalization-bias correction also showed a similar overestimation (Figure 3—figure supplement 5, emphasizing the importance of this correction. The MSDi-based methods again provided divergent results, highlighting that accurate fitting of the diffusion coefficient distribution does not guarantee accurate inference of DFREE and FBOUND.
A detailed comparison of the methods is available in Appendix 1. Furthermore, we extended the simulation analysis to a three-state model (one ‘bound’, two ‘free’ states), comparing Spot-On and vbSPT. Spot-On demonstrated superior accuracy in inferring both diffusion constants and subpopulation fractions (Figure 3—figure supplement 6).
Robustness of Spot-On: Sensitivity Analysis and Data Requirements
We further assessed the robustness of Spot-On. The method’s ability to infer DFREE and FBOUND was robust to misestimates of the axial detection range (~100–200 nm; Figure 3—figure supplement 7, minimally affected by the number of timepoints and fitting parameters (Figure 3—figure supplements 8–[9](/articles/33125/figures#fig3s9]; Appendix 2), and relatively unaffected by state changes (binding/unbinding) when these changes were significantly slower than the frame rate (Figure 3—figure supplement 10.
Spot-On also accurately inferred the localization error with nanometer precision when a substantial bound fraction was present (Figure 3—figure supplement 11. Subsampling analysis revealed that approximately 3000 short trajectories (mean length ~3–4 frames) were sufficient for reliable inference of the underlying dynamics (Figure 3—figure supplement 12.
Conclusion: Spot-On as a Reliable Tool for SPT Analysis
In summary, our analysis of simulated SPT data indicates that Spot-On effectively addresses defocalization and analysis method biases (Figure 1C–D). It provides accurate and robust estimates of subpopulations and diffusion constants across a wide range of dynamics, surpassing the performance of other commonly used methods. This guide illustrates the strengths of Spot-On as a powerful tool in the single-particle tracking field.