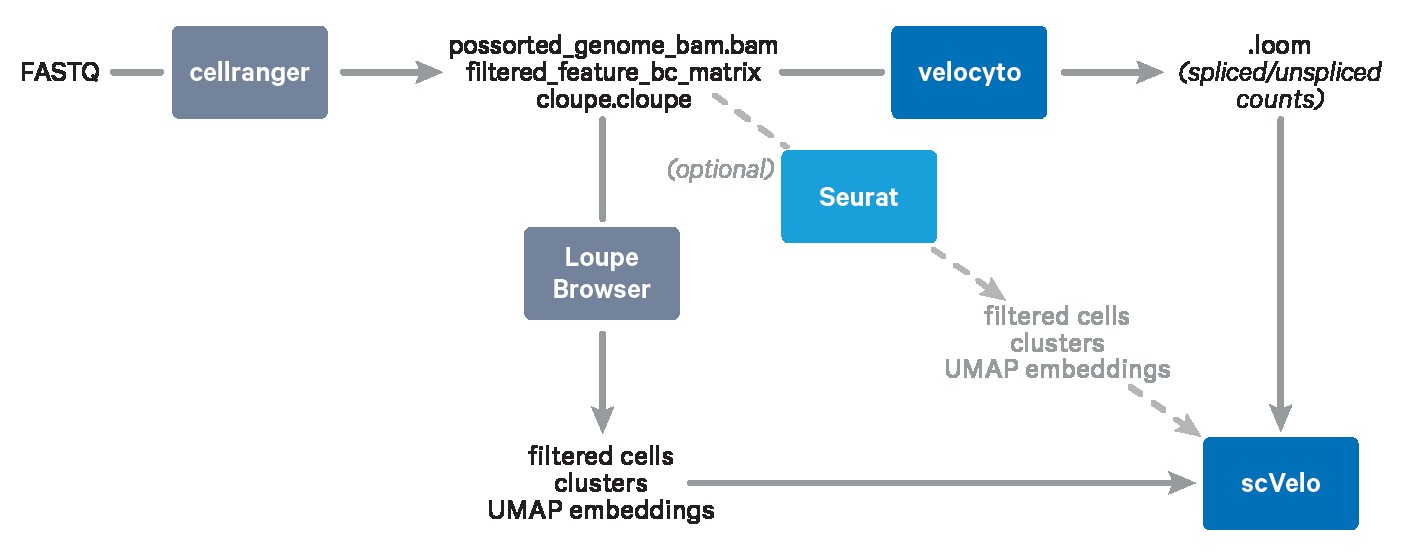
Trajectory inference and RNA velocity analysis are powerful techniques used to understand cellular dynamics based on single-cell gene expression data. These methods allow researchers to reconstruct the dynamic processes cells undergo, such as differentiation, maturation, and responses to stimuli. RNA velocity, in particular, leverages the information from unspliced and spliced transcript levels to predict a cell’s future state, enhancing the accuracy of inferred trajectories. This guide provides a comprehensive overview of how to perform trajectory inference and RNA velocity analysis, focusing on integrating data from Cell Ranger and Loupe Browser with community-developed tools.
Software and Data Requirements
To perform the analysis described in this guide, you will need the following software packages:
Essential:
Highly Recommended:
- A Linux server with sufficient computing resources (RAM/CPUs) to run the
velocytopipeline efficiently. This pipeline is computationally intensive. - Jupyter Notebook for interactive data exploration and analysis.
Optional:
- Single-cell gene expression data generated by Cell Ranger. If you don’t have your own data, you can use the neutrophil dataset as an example. You can generate the required Cell Ranger output files by following the Capturing Neutrophils in 10x Single Cell Gene Expression Data tutorial.
For reference, key intermediate files and expected outputs are provided in the original article.
Step-by-Step Guide to Trajectory Inference and RNA Velocity
This guide walks you through the process of performing trajectory inference and RNA velocity analysis using data processed with Cell Ranger and Loupe Browser.
Step 1: Exporting Projections and Clusters from Loupe Browser
The initial step involves exporting relevant data from Loupe Browser. If your dataset contains multiple cell types, you should first annotate the cell types of interest. In this example, we focus on neutrophils. Therefore, you need to export the UMAP embeddings and cluster assignments specifically for neutrophils.
Detailed instructions on raw data processing and cell type annotation can be found in the Tutorial: Capturing Neutrophils in 10x Single Cell Gene Expression Data. Exporting projections and clusters is described here.
Step 2: Preparing the Conda Environment
A dedicated conda environment is highly recommended to manage the required software dependencies. Conda simplifies the installation and management of Python packages, ensuring compatibility and reproducibility.
-
Install Conda: If you don’t have conda installed, follow the installation instructions for your operating system from the official conda documentation.
-
Create a Conda Environment: Download the provided YAML file, which lists the necessary packages. Execute the following command in your terminal, in the same directory as the downloaded YAML file:
conda env create --file TutorialEnvironment.ymlThis command creates a new conda environment named “tutorial” (or whatever name you specify in the YAML file) with all the required packages installed.
Step 3: Running Velocyto for Spliced/Unspliced Transcript Quantification
Velocyto is a powerful tool for quantifying spliced and unspliced transcripts from single-cell RNA sequencing data. This information is crucial for estimating RNA velocity.
-
Activate the Conda Environment:
conda activate tutorial -
Run Velocyto: Velocyto requires two inputs: the Cell Ranger output directory and a genome annotation file (GTF). Ensure the GTF file matches the reference used in Cell Ranger. The reference path can usually be found in the Web Summary Sample section of the Cell Ranger output. Execute the following command, replacing the placeholders with the correct paths:
velocyto run10x /path/to/cellranger-runs/sample_name /path/to/refdata-gex-GRCh38-2020-A/genes/genes.gtfVelocyto is resource-intensive and can take a significant amount of time to complete. A high-performance computing (HPC) cluster or a workstation with ample RAM and CPU cores is recommended.
Upon successful completion, Velocyto generates a
.loomfile (e.g.,velocyto/sample_name.loom) within the Cell Ranger output directory. This file contains the spliced and unspliced transcript counts.If you prefer to skip this step, a pre-processed loom file is available for download.
Step 4: Performing RNA Velocity Analysis with scVelo
ScVelo is a scalable toolkit designed for RNA velocity analysis. It leverages splicing kinetics to infer cell state transitions and reconstruct developmental trajectories.
-
Download Input Files (Optional): If you skipped Step 3, download the required input files:
mkdir input-files
curl -o input-files/filtered_feature_bc_matrix.tar.gz https://cf.10xgenomics.com/supp/cell-exp/neutrophils/filtered_feature_bc_matrix.tar.gz
curl -o input-files/WB_Lysis_3p_Introns_8kCells.loom https://cf.10xgenomics.com/supp/cell-exp/neutrophils/WB_Lysis_3p_Introns_8kCells.loom
curl -o input-files/3p-Neutrophils-clusters.csv https://cf.10xgenomics.com/supp/cell-exp/neutrophils/3p-Neutrophils-clusters.csv
curl -o input-files/3p-Neutrophils-UMAP-Projection.csv https://cf.10xgenomics.com/supp/cell-exp/neutrophils/3p-Neutrophils-UMAP-Projection.csv
tar -xvzf input-files/filtered_feature_bc_matrix.tar.gz -C input-files/
ls -lahR input-files
These commands create a directory named
input-files, download the necessary files, and extract the gene expression matrix. -
Open Jupyter Notebook and Import Libraries: Open the provided Jupyter notebook file in Jupyter Notebook. Import the required Python libraries:
import numpy as np
import pandas as pd
import matplotlib.pyplot as pl
import scanpy as sc
import igraph
import scvelo as scv
import loompy as lmp
import anndata
import warnings
warnings.filterwarnings('ignore')
If you encounter a “ModuleNotFoundError,” ensure that all required packages are installed in your conda environment.
-
Import Matrix: Load the filtered gene expression matrix from Cell Ranger into scVelo:
# Define Path to the matrix output from cellranger
Path10x='./input-files/filtered_feature_bc_matrix/'

# Read matrix
Neutro3p = sc.read_10x_mtx(Path10x,var_names='gene_symbols',cache=True)

# Print information on this new object
Neutro3p
This creates an AnnData object named
Neutro3pcontaining the gene expression data. -
Import Clusters and Projection: Import the cluster assignments and UMAP embeddings exported from Loupe Browser:
# Read clusters
Clusters_Loupe = pd.read_csv("./input-files/3p-Neutrophils-clusters.csv", delimiter=',',index_col=0)

# Create a list with only neutrophil Barcodes, because the dataset included other cell types.
Neutrophils_BCs=Clusters_Loupe.index

# Read UMAP embeddings
UMAP_Loupe = pd.read_csv("./input-files/3p-Neutrophils-UMAP-Projection.csv", delimiter=',',index_col=0)

# Select neutrophil barcodes in the projection
UMAP_Loupe=UMAP_Loupe.loc[Neutrophils_BCs,]

# Tansform to Numpy
UMAP_Loupe = UMAP_Loupe.to_numpy()

# Filter cells for only neutrophils
Neutro3p=Neutro3p[Neutrophils_BCs]

# Import cluster information into Neutro3p object
Neutro3p.obs['Loupe']=Clusters_Loupe

# Import UMAP information into Neutro3p object
Neutro3p.obsm["X_umap"]=UMAP_Loupe

# Print information about the object
Neutro3p
This step integrates the Loupe Browser annotations into the AnnData object.
-
Import Spliced/Unspliced Counts: Import the
.loomfile generated by Velocyto, merging the spliced and unspliced transcript counts into theNeutro3pobject:# Read velocyto output VelNeutro3p = scv.read('./input-files/WB_Lysis_3p_Introns_8kCells.loom', cache=True) # Merge velocyto with cellranger matrix Neutro3p = scv.utils.merge(Neutro3p, VelNeutro3p) -
Run Velocity Analysis: Perform the core velocity analysis using scVelo. This involves preprocessing, moment estimation, velocity calculation, and latent time recovery:
# Standard scvelo processing to run Dynamical Mode scv.pp.filter_and_normalize(Neutro3p, min_shared_counts=30, n_top_genes=2000) scv.pp.moments(Neutro3p, n_pcs=30, n_neighbors=30) # Estimate RNA velocity and latent time scv.tl.recover_dynamics(Neutro3p) scv.tl.velocity(Neutro3p, mode='dynamical') scv.tl.velocity_graph(Neutro3p) scv.tl.recover_latent_time(Neutro3p) -
Visualization: Visualize the results using various scVelo plotting functions:
-
Velocity Stream Plot Colored by Cluster:
# Generate plot with UMAP and cluster scv.pl.velocity_embedding_stream(Neutro3p,basis="umap",color="Loupe",title='Neutrophils',fontsize=20,legend_fontsize=20,min_mass=2,palette=Colorss,save='scVelo-umap-cluster.png') -
Velocity Stream Plot Colored by Latent Time:
# Generate plot with UMAP and latent time scv.pl.velocity_embedding_stream(Neutro3p,basis="umap",color="latent_time",title='Neutrophils',fontsize=20,legend_fontsize=20,min_mass=2,color_map="plasma",save='scVelo-umap-latent_time.png') -
Violin Plot of Latent Time per Cluster:
sc.pl.violin(Neutro3p, keys='latent_time',groupby="Loupe",order=["Cluster 4","Cluster 1","Cluster 5","Cluster 6","Cluster 7","Cluster 3","Cluster 2"],save='scVelo-violin-latent_time.png') -
Heatmap of Neutrophil Maturation Genes Ordered by Latent Time:
Genes=["RETN","LTF","CAMP","ACTB","GCA","LCN2", "S100A8","MYL6","S100A9","FCGR3B","S100A11","FTH1","IFIT1", "IFITM3","IFIT3","ISG15","IFIT2","RPS9","NEAT1","MALAT1","NFKBIA","CXCL8"]
scv.pl.heatmap(Neutro3p, var_names=Genes, sortby='latent_time', col_color='Loupe', n_convolve=100,figsize=(16,8),yticklabels=True,sort=True,colorbar=True,show=True,layer="count",save='scVelo-heatmap-latent_time.png')
The heatmap visualizes gene expression changes along the inferred trajectory, revealing patterns associated with cell maturation.
-
Alternative: Importing a Seurat Object
If you have pre-processed your data using Seurat, you can import your Seurat object into scVelo for trajectory analysis.
-
Save Seurat Object in R: In R, after completing standard Seurat processing, save the Seurat object as a
.loomfile:## This step is done in R after Seurat processing Neutro3p.loom <- as.loom(Neutro3p, filename = "/path/to/Neutro3pSeurat.loom", verbose = FALSE) Neutro3p.loom$close_all() -
Load Loom File in scVelo: In the scVelo notebook, replace the
sc.read_10x_mtxfunction call in Step 4.3 withscv.read_loom:Neutro3p = scv.read_loom("./Neutro3pSeurat.loom")The rest of the scVelo analysis steps remain the same.
Conclusion
This guide provides a detailed walkthrough of trajectory inference and RNA velocity analysis using scVelo, integrating data from Cell Ranger and Loupe Browser. The same workflow can be applied to other cell types to study their dynamic behavior.
While this guide focuses on velocyto and scVelo, other community-developed tools are available for trajectory inference and velocity analysis. Further exploration of these tools can provide complementary insights.